")
")
NetPOD EVO - Functional Modules
Intelligen Event Processor
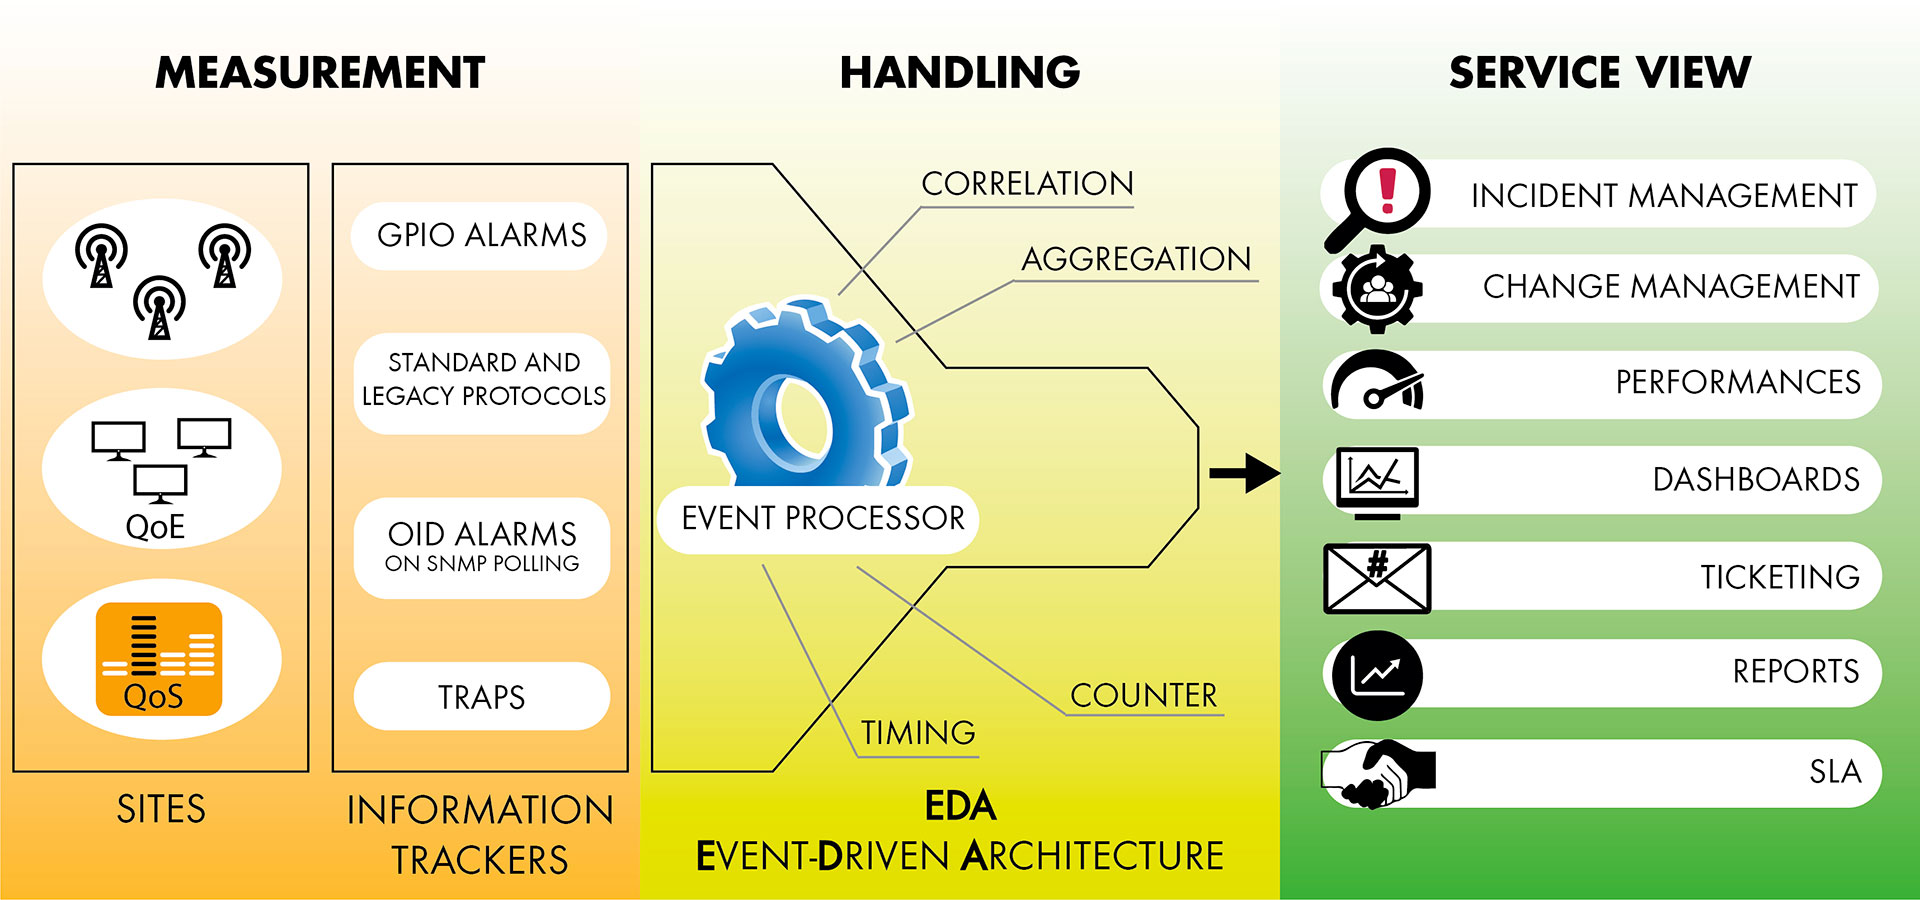
The Intelligent Event Processor allows the processing of any combination of data, events, alarms, time or period with smart rules created by graphical tools. The large number of events that happen in a big network require a smart technology to manage all this information.
The IEP was designed for the correlation, aggregation, filtering, acknowledging, enrichment and root cause analysis of the events gathered by the system from different subsystems and devices. Actions can be taken by the system to manage incident, send notifications, run automations, calculate performances, open tickets,…
Business Intelligence
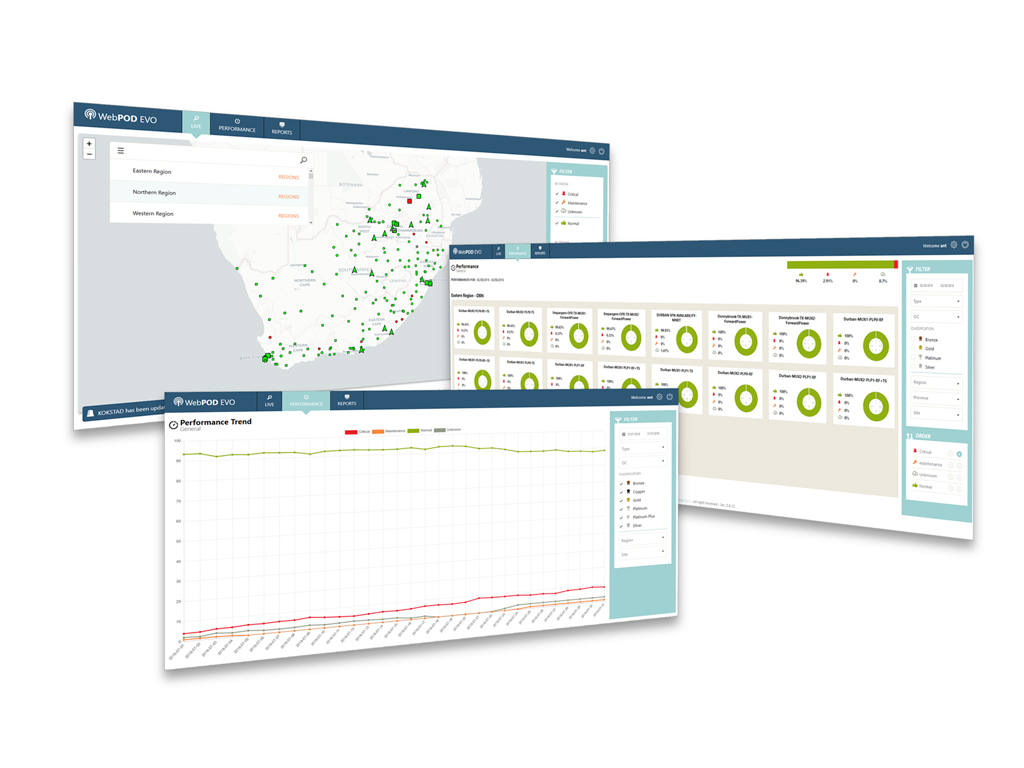
WebPod is the web application used for the business intelligence analysis and for the performance monitoring and network performance trend analysis.
The system allows operators to manage a large amount of data through an intelligent dashboard that can display both historical and real time data.
Features
- Geospatial mapping of services valuable data
- Operational dashboard and reports
- Create cross functional reports and dashboards
- View business health across services
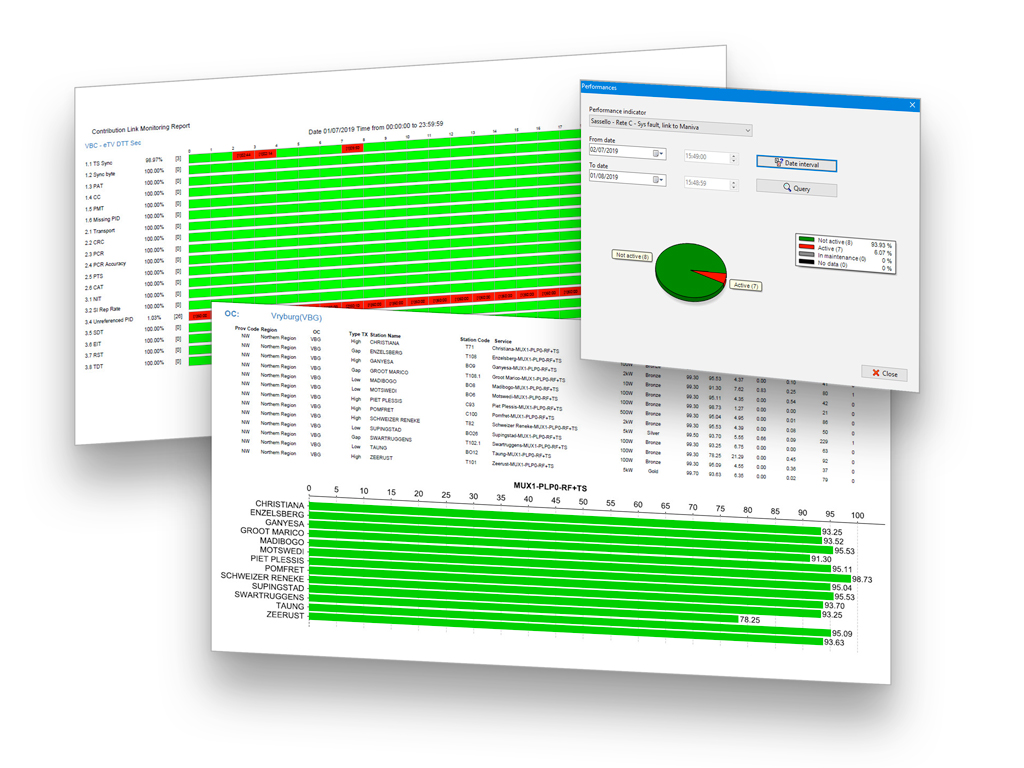
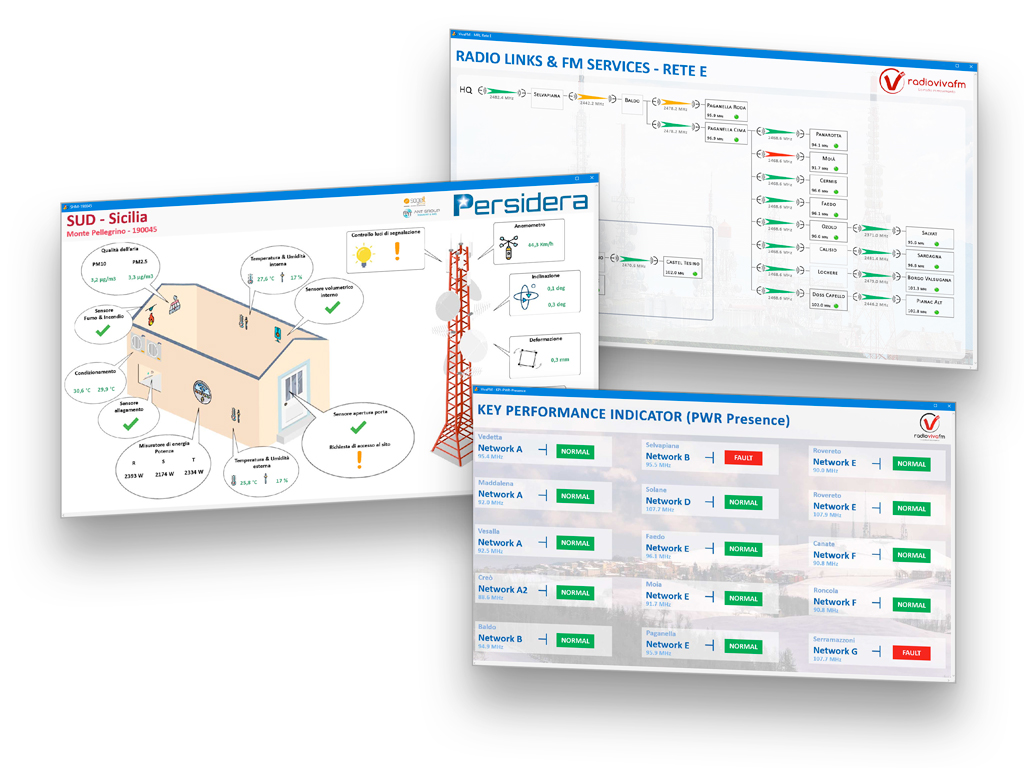
Performance Management
Create insightful KPI dashboards quickly and easily to track your significant key performance indicators. Tracking the key performance indicators is the way to empower the business services. This module has the capability to collect enormous amount of data from the network elements regarding its performance, availability, problem scenarios, etc. KPI can be created on insightful aggregation of these data and generate results. In NetPOD the KPI Engine is implemented as an aggregation engine from the IEP capable of calculate statistics collected and managed in the system. In network management, every KPI can be matched to thresholds to determine the severity levels of a network activity. The Service Level Agreement (SLA) goals are directly mapped to these thresholds. When the threshold is reached, and the SLA is violated, appropriate action needs to be taken.
One can access real time information or calculate the SLA (Service Level Agreement) filtered by the period (daily, weekly, monthly or yearly) and type (Operator, MUX, Service, Region, Area, Structure, etc.).
Features
- Live network performance
- Performance trend analysis
- Report generation and download tool
- Incident management
- Predictive analysis
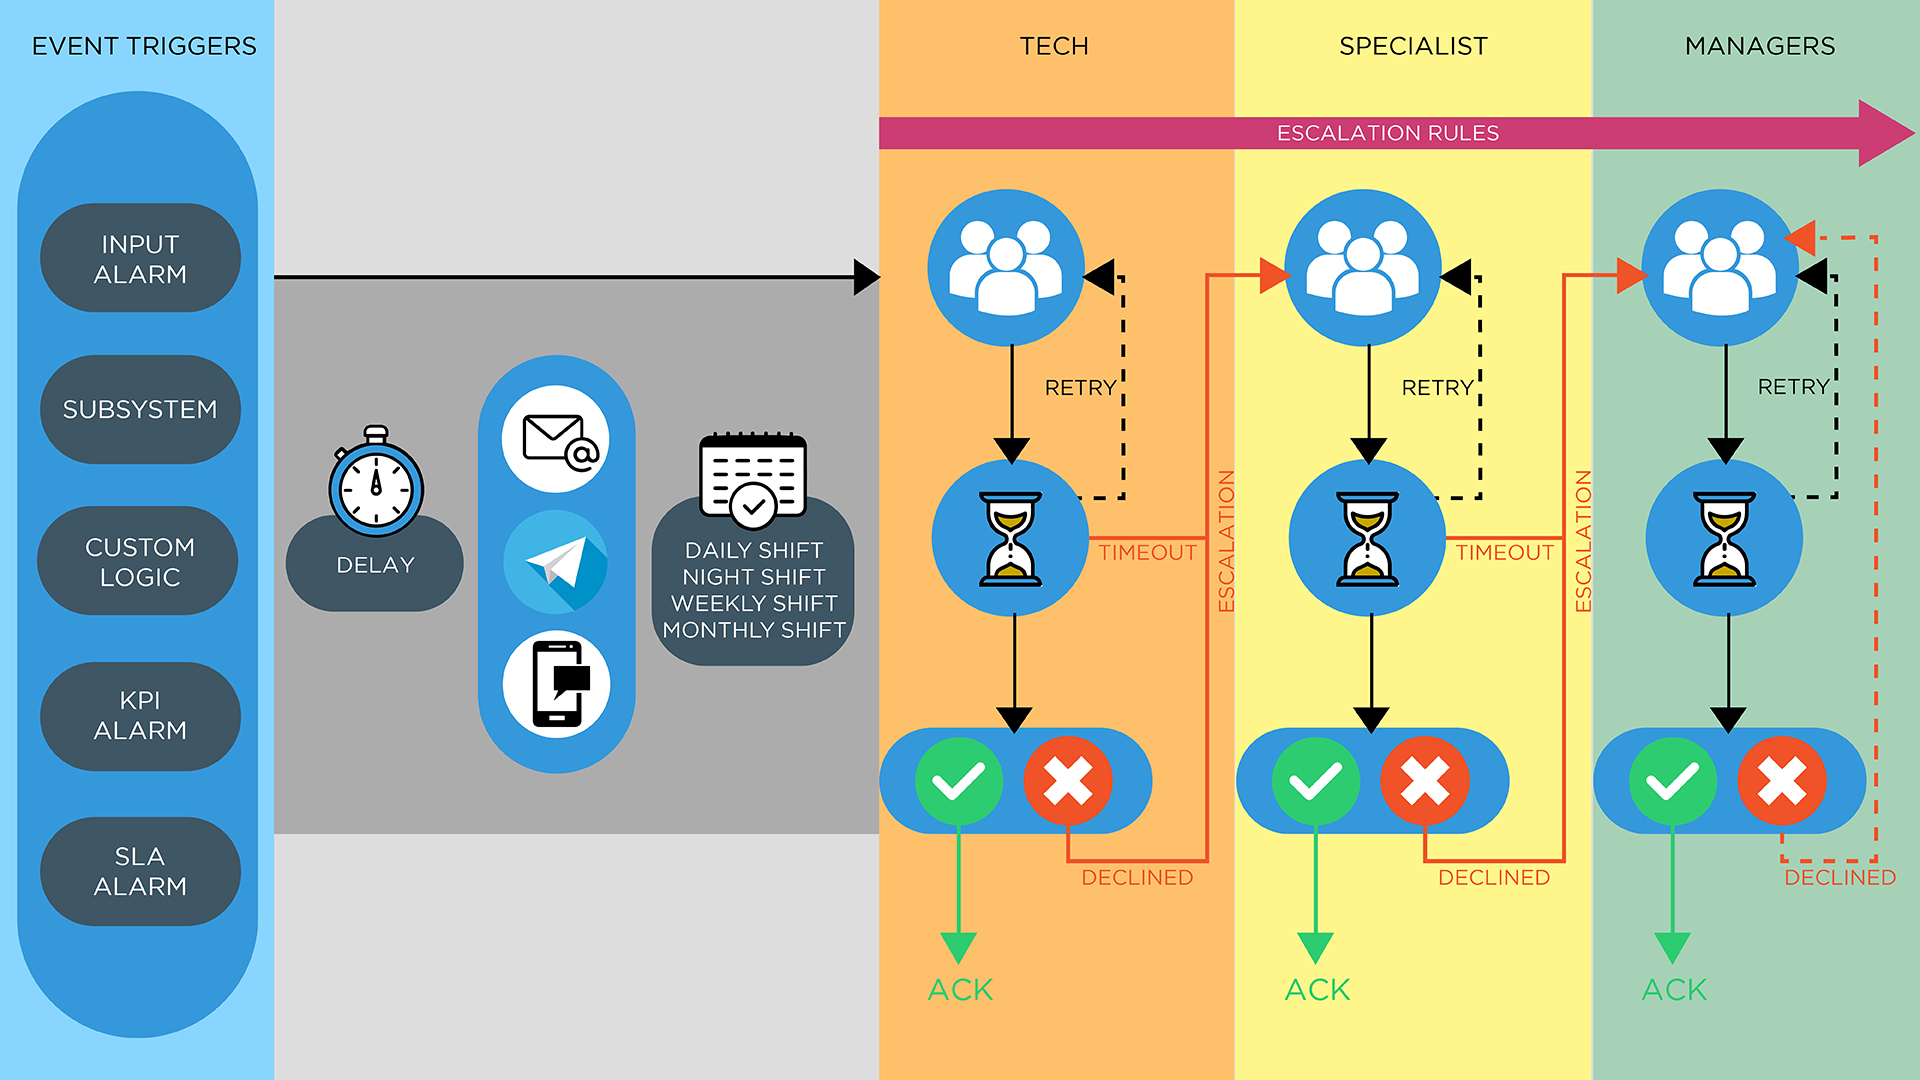
Callout
The Callout functional module it’s the NetPod software module which aims to report to the service personnel about critical situations on their sites using mainly Telegram messages with confirmation and acknowledge in a customizable escalation process.
Features
- Create an unlimited number of callout profiles
- Each profile can be customized with an unlimited number of actions to implement the escalation process
- Fully Telegram integration
- Can send messages with request of confirmation
- Ability to send SMS and/or email to multiple recipients as CC
- Can send commands (SNMP SET) to any of the network elements
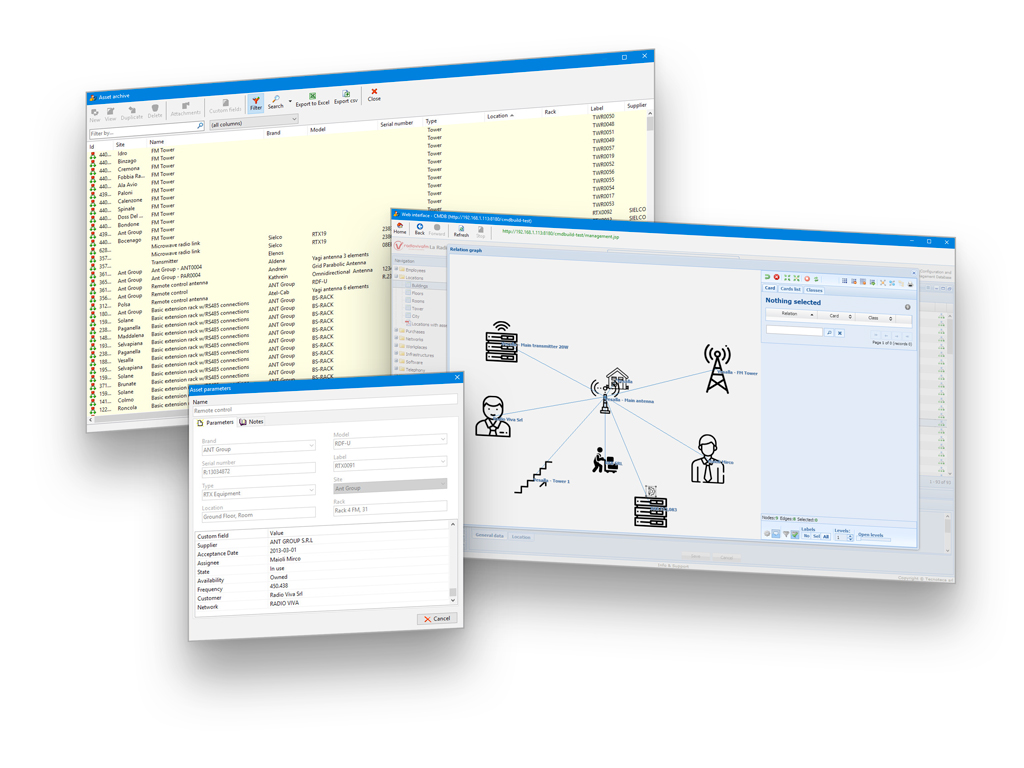
Configuration Management Data Base
As a central inventory & asset management the CMDB system provides complete details about the equipment used, installed or in stock owned by the customer…
This module allows the system to enrich incidents and alarms with specific device information. So, it provides also the ability to:
- Manage the Reports and export them to Excel or CSV formats that can be integrate with third-party reporting engines or print it out for future reference
- Manage Incident and Change processes based on ITIL best practice
- Archive any photos, manuals and related documents of your inventory
All these features are extremely configurable following the organization structure. Through these features, it allows to keep under control the situation of assets, knowing always the composition, dislocation, functional relations, rules for updating over time, and managing the complete lifecycle.
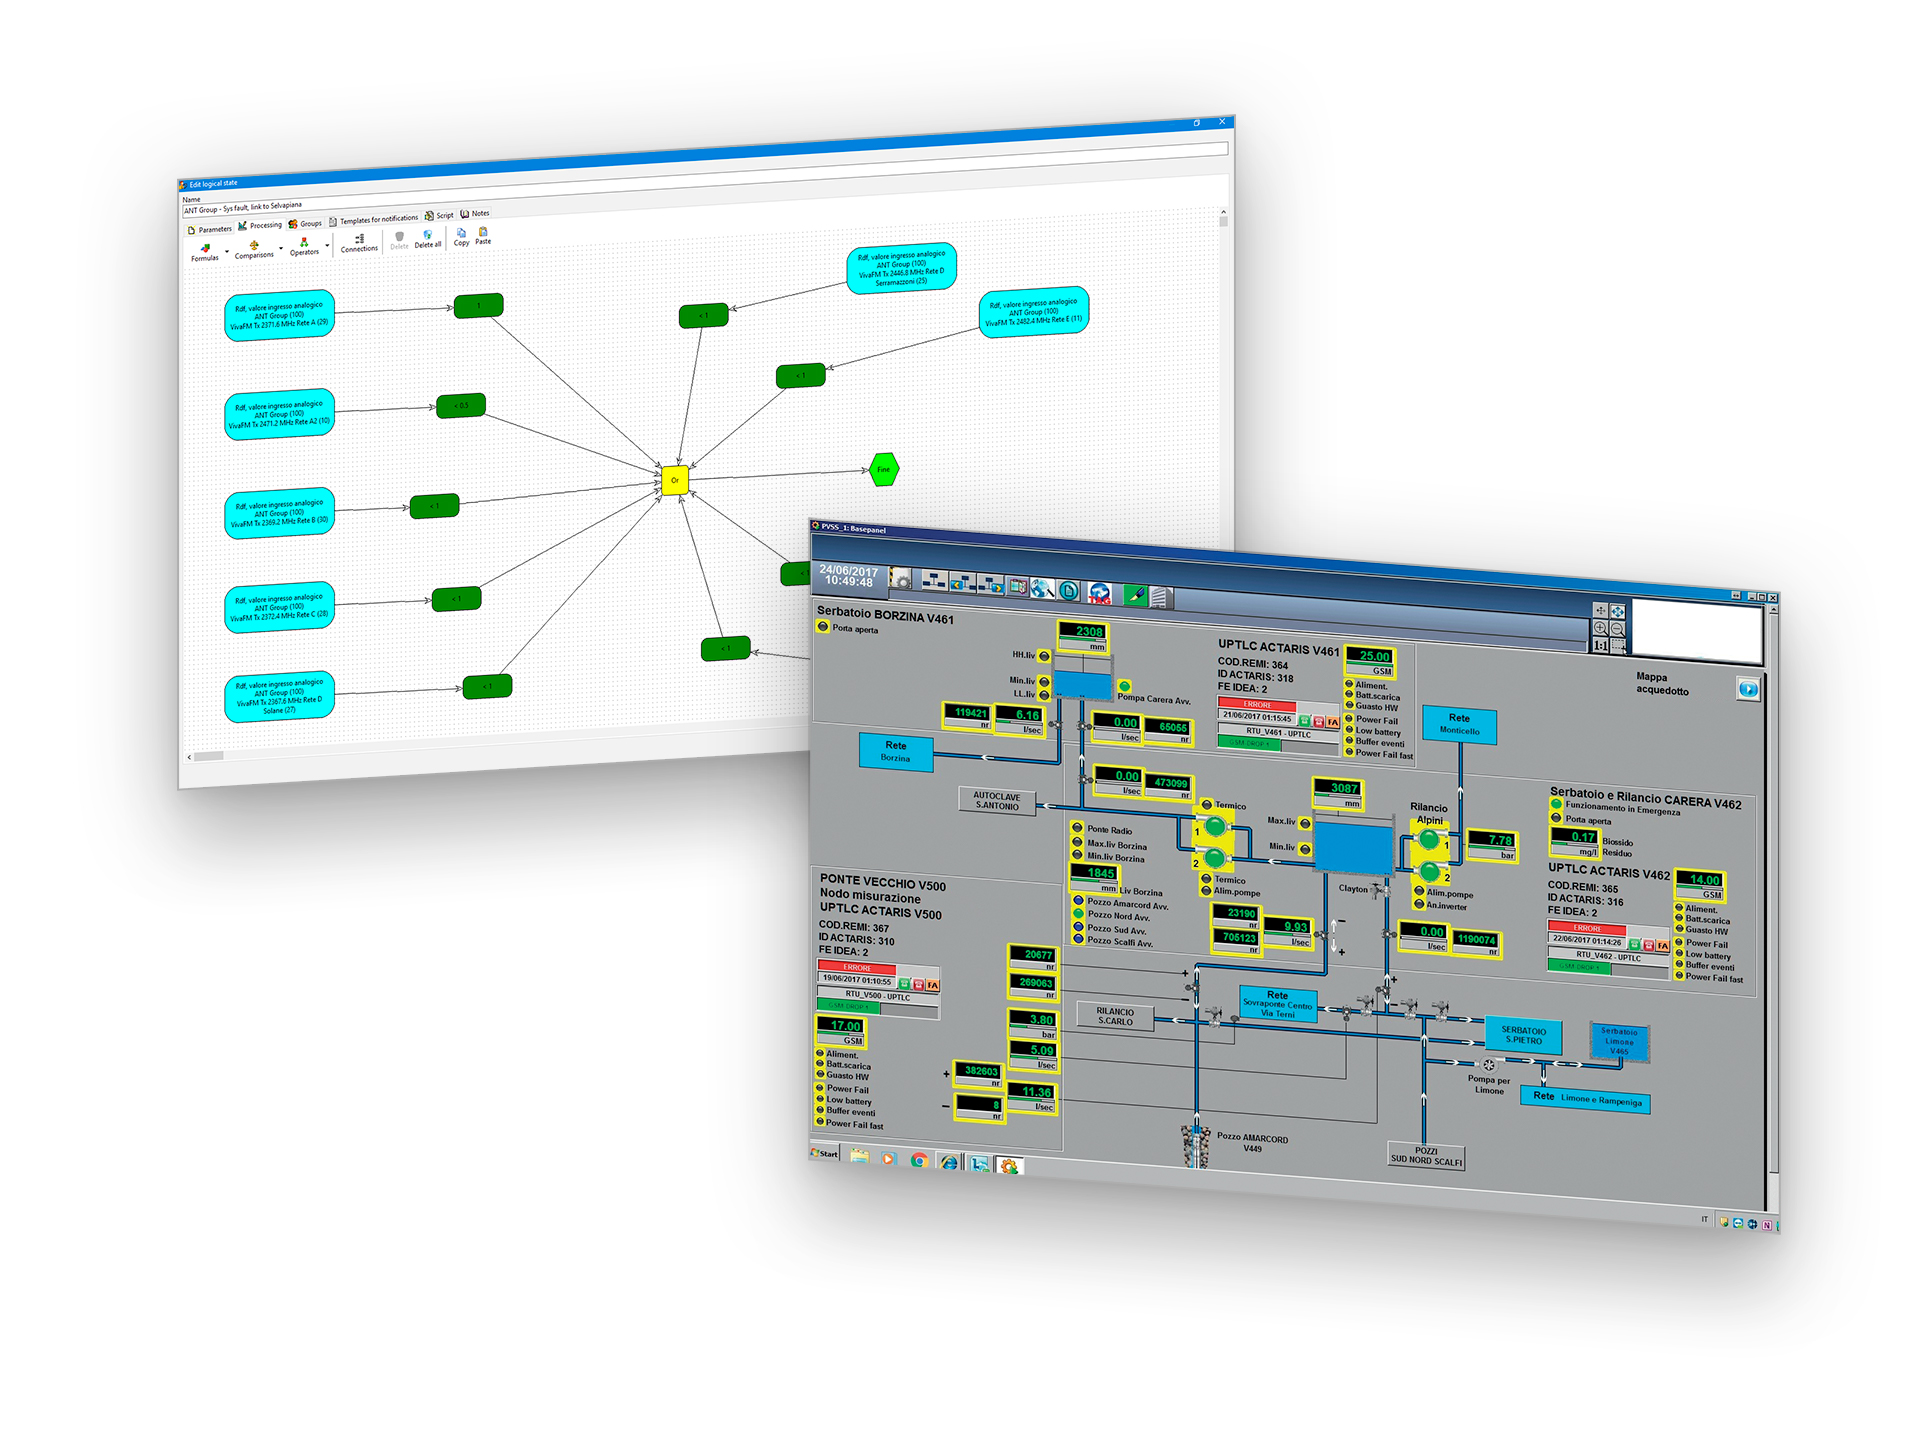
User Definable Screens
A useful tool to create custom dashboards views: it consists in a set of widgets which are good for building panels, charts or diagrams, facility/floor plans and human-machine interfaces (HMI). The UDS module allows to associate different data typologies like spectrum monitoring, any type of data inputs/outputs, enumerated values and formulas and put them in the same window to represent information, device status, service failure in a graphical way. These interfaces can be used to control, configure or monitor all different network devices. For example, UDS can be used to concentrate all links of several broadcasting sites, or to monitor the complete STL chain from the studio to the last transmitter, or to design a command panel to manage the status of a transmitter as you were in front of it. All this can be set in one or “n” UDS dashboards windows.
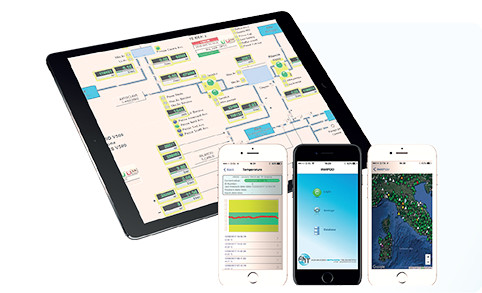
Mobile Client
Client for iOS and Android
Application for iPhone®, iPad® and Android devices that enables you to monitor and manage your network in mobility.
Ideal for technicians on the territory to manage the assigned equipment, tickets, inventory, etc.
CTO can see the performance of all network in your hand.
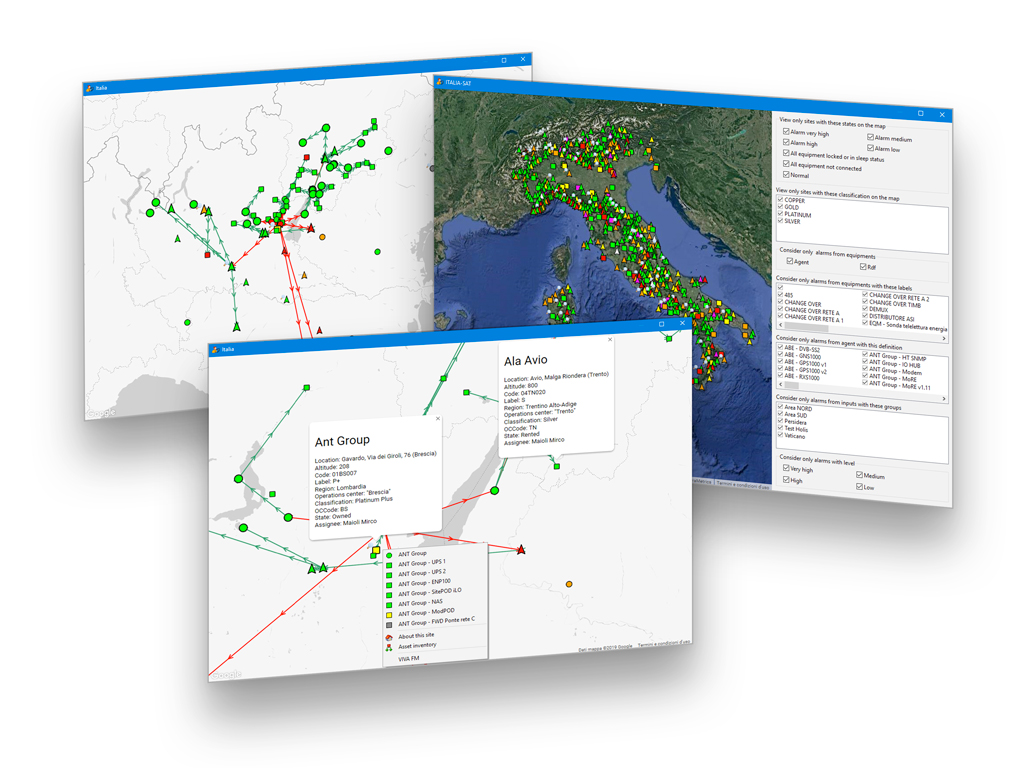
Georeferenced Maps
The Georeferenced Maps enables the user, to create maps based on Google Maps™. The site location is defined with longitude and latitude by the data achieved in the asset management.
Sites are placed automatically on the map in the exact location. Maps can be created in an unlimited number and the user can customize them in style and data visualization. The client requires an internet connection.
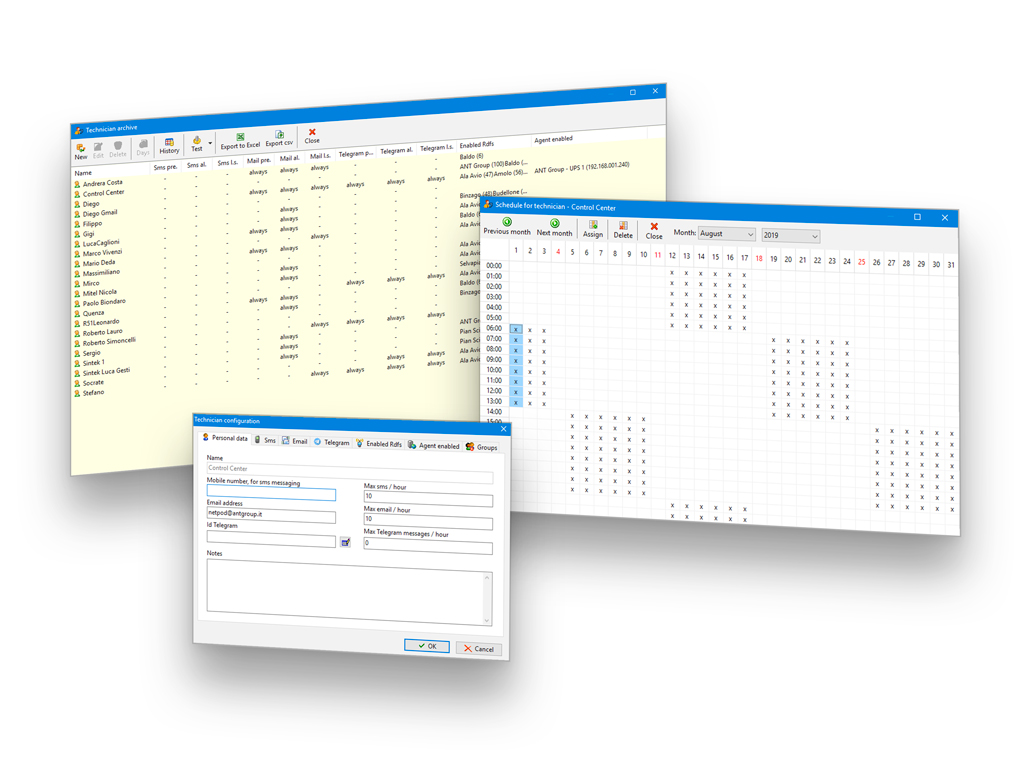
Technicians
This functional module extends alarm forwarding rules adding new entities to the system: the technician list. Technicians can be divided in geographical or technical areas of responsibility based on customer’s organization in order to forward notifications to the right people so that, for example, RF technicians won’t be disturbed by electrical problems, and so on.
The system can be configured to send telegram notifications, e-mails and/or SMS, based on the work shifts and the availability of the technicians and on escalation rules. All commands, response and alarms sent/received by a technician are logged.
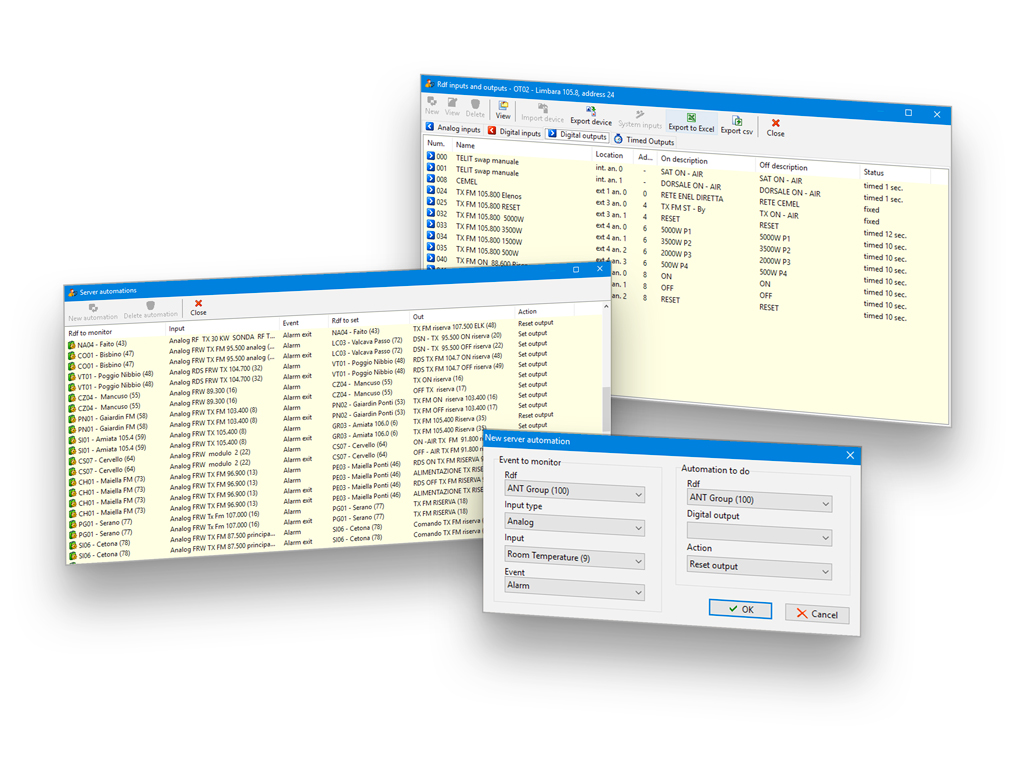
Server Automations
Allows creating an unlimited number of “server side” or “remote side” (* only with SitePod) managed automation or schedule operations in an easy and intuitive way using data managed by the system.
The automation will controls any alarmed or pre-alarmed input when it changes its status (rising edge or falling edge). The wide range of scheduling options allow running scheduled tasks automatically once, secondly, minutely, hourly, daily, monthly, yearly, in specified period with correlation of alarm/events.
Proxy HTTP
Integrate the direct management of any devices configurable via web browser. This gateway permits to grant to the system users to open the web interface of the network elements following the user permissions.
For security purposes or for network structure problems some devices could be on a private network or on a public network but encapsulated in a VPN tunnel (virtual private network), and therefore it is not possible to reach them. The “http proxy” module overcomes this obstacle allowing the management of web server enabled equipment for the NetPOD interface.
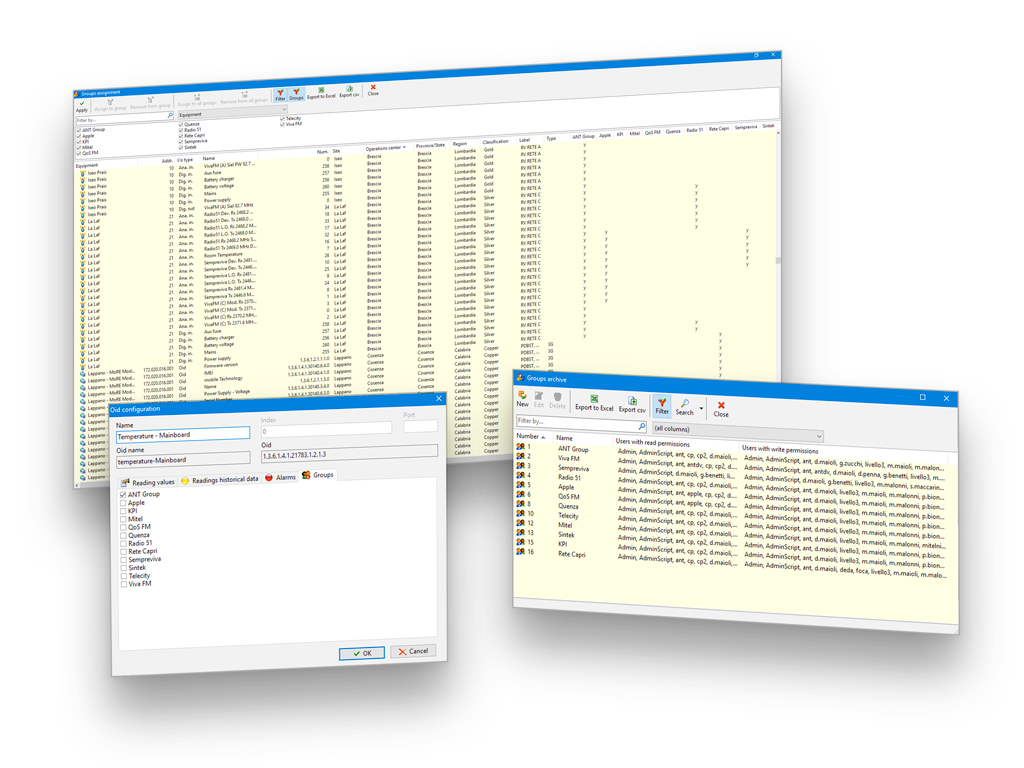
Groups
Grant user access to specific I/Os allowing the visualization of specific input / output / device only to authorized users. Basically, the network is split to create different layers of representation in a user-level or geographical way, associated with one or more groups.
The user will not see the measures that have not been associated as well as the relative alarms, messages or sites on the map. Furthermore, for each group one can specify both the reading and writing permissions.
Legacy NetPOD Functional Modules (RDF)
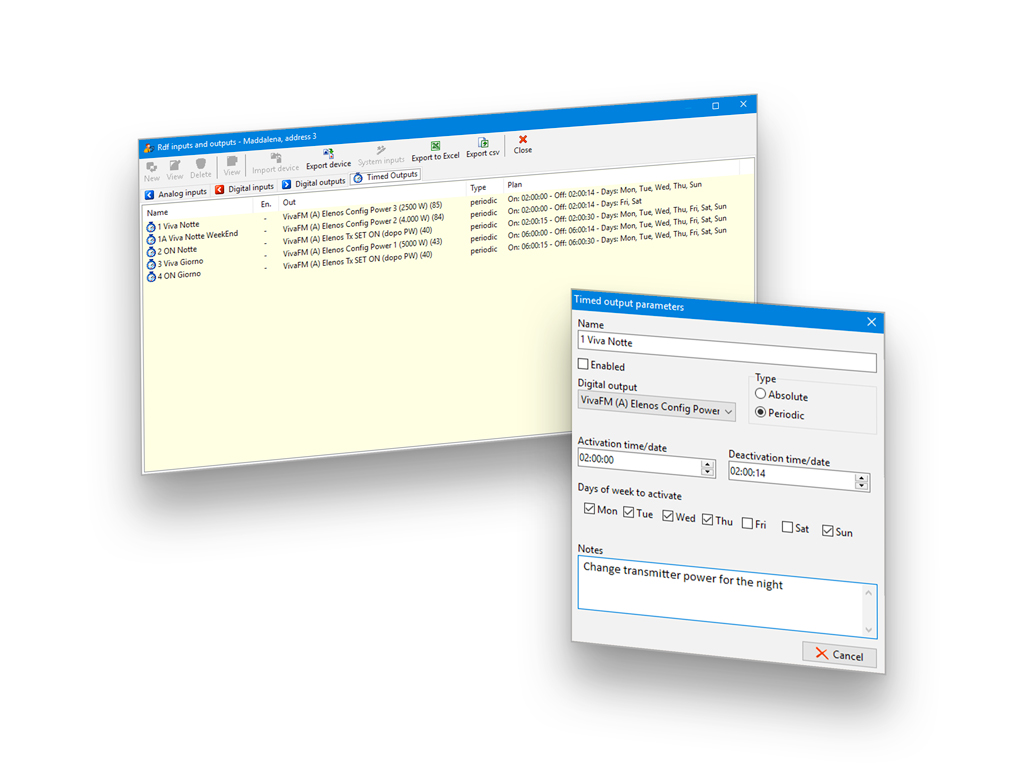
Timed Outputs
To activate commands at preset timetables.
The timed outputs module allows the supervisor to set up the SET and RESET of a RDF output at a preset time or even to enable an ‘automation program’ periodically. Periodical activation can be programmed daily or according to a weekly timetable. The module is therefore very useful whenever you want the RDF to execute a command, or a sequence of commands, autonomously at preset times (absolute) or at regular intervals (periodic).
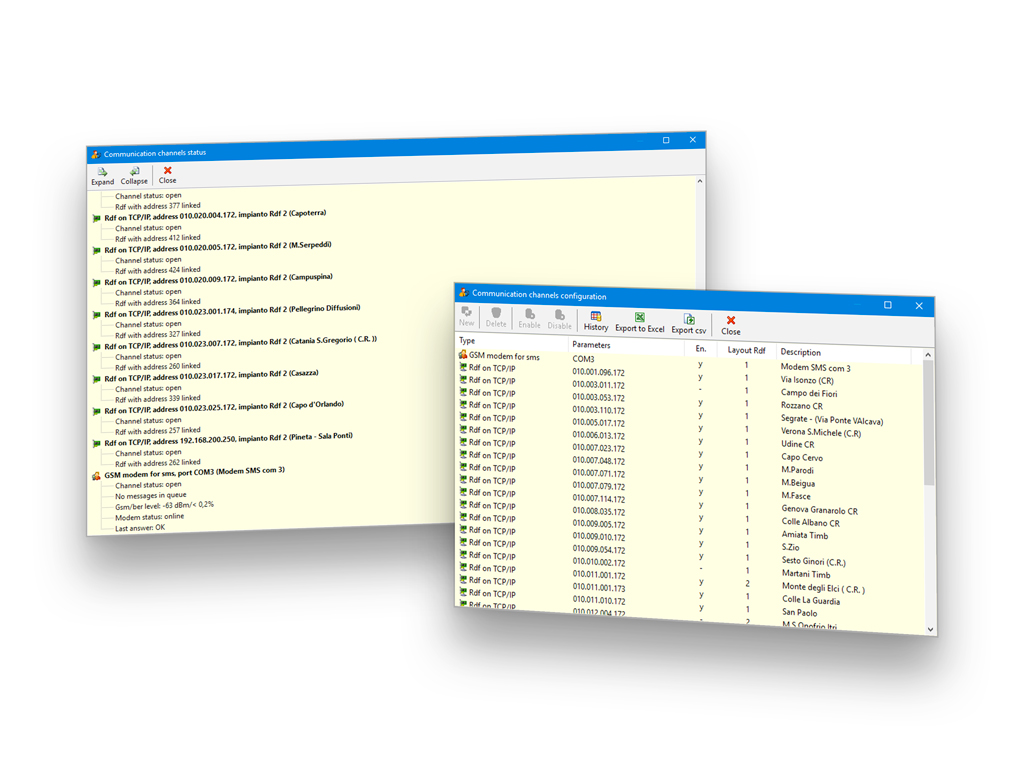
CDMA/GPRS
GPRS & CDMA modem management module.
The GPRS and the CDMA use the internet over GSM (GPRS) and internet over CDMA to carry data from one remote site data concentrator (RDF) to the control center. At any connection, the telecom network manager assigns an IP address, and this IP address changes every new connection. That’s why we have designed a dedicated SW to manage these connections. The IP address of the control center is fixed.
Local RDF Automation
To add local and remote automations managed by and performed on the RDF.
You can create and store in the peripheral some “automations” and the RDF will perform them without asking or needing to connect to the control center, Automations will be started following an event or a level measurement at a set input and can start on the RDF itself or another RDF, according to the automation type. The automation can end automatically or after the input level, that has started the automation, return inside and set limit.